Pie Chart Infographic Template
Pie Chart Infographics Templates
Free PowerPoint template and Google Slides theme
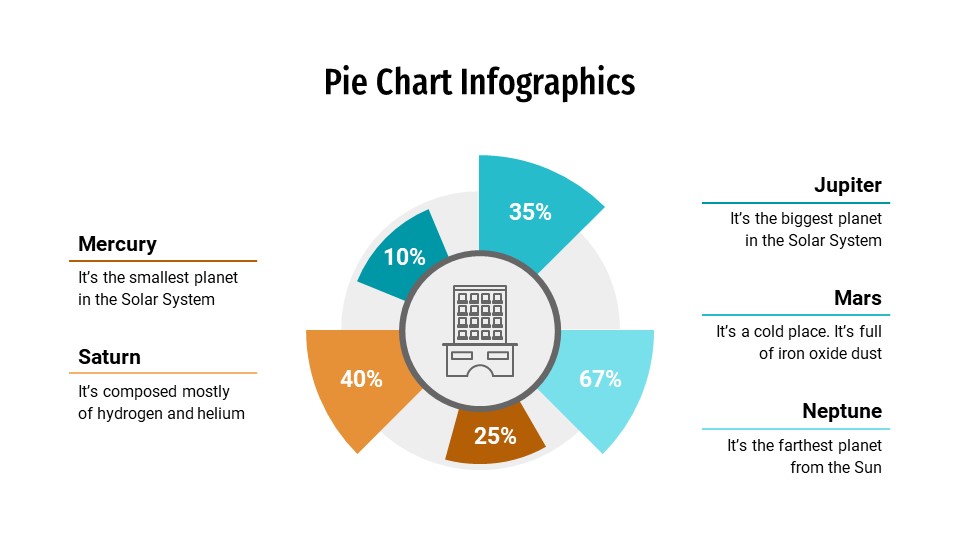
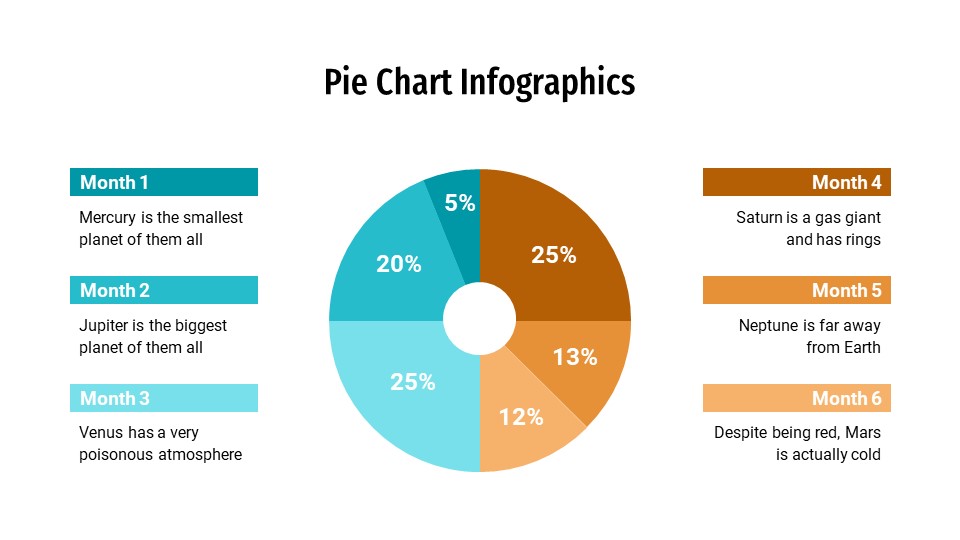
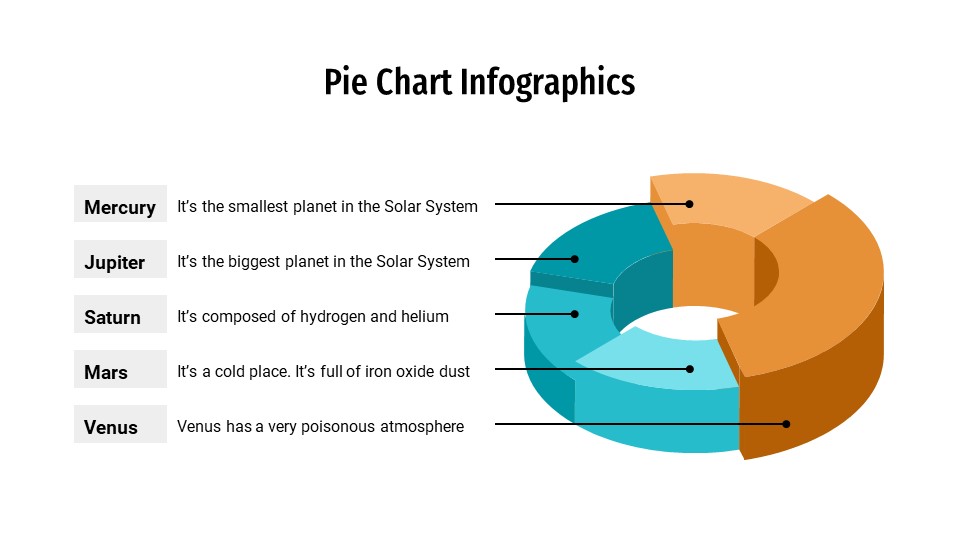
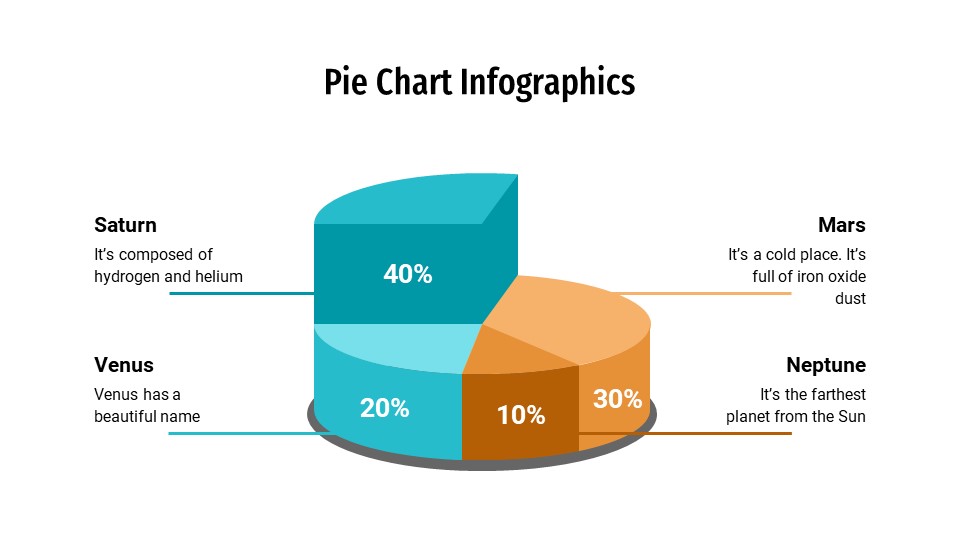
Pie charts are powerful visual tools that you can use to represent and compare percentages or proportions, and they can be useful in multiple scenarios, such as showing data about your company, describing your customer distribution, or even for medical or educational topics.
This template contains 30 different pie charts and uses a palette of light blue and yellow colors that you can customize, of course.
Features of these infographics
Circular infographics and chart visualizations
100% editable and easy to modify
30 different infographics to boost your presentations
Designed to be used in Google Slides, Microsoft PowerPoint and Keynote
16:9 widescreen format suitable for all types of screens
Share Now!

