Incorporating a table into your PowerPoint presentation is an excellent and efficient way to enhance your content. Tables can range from simple rows and columns to complex infographics, offering versatile solutions for comparing data and summarizing information.
In this tutorial, you’ll learn how to create and format tables in PowerPoint from scratch. Additionally, we’ll explore how to download pre-designed infographic tables from ready-to-use templates, providing further customization options for your presentation.
Creating a Table
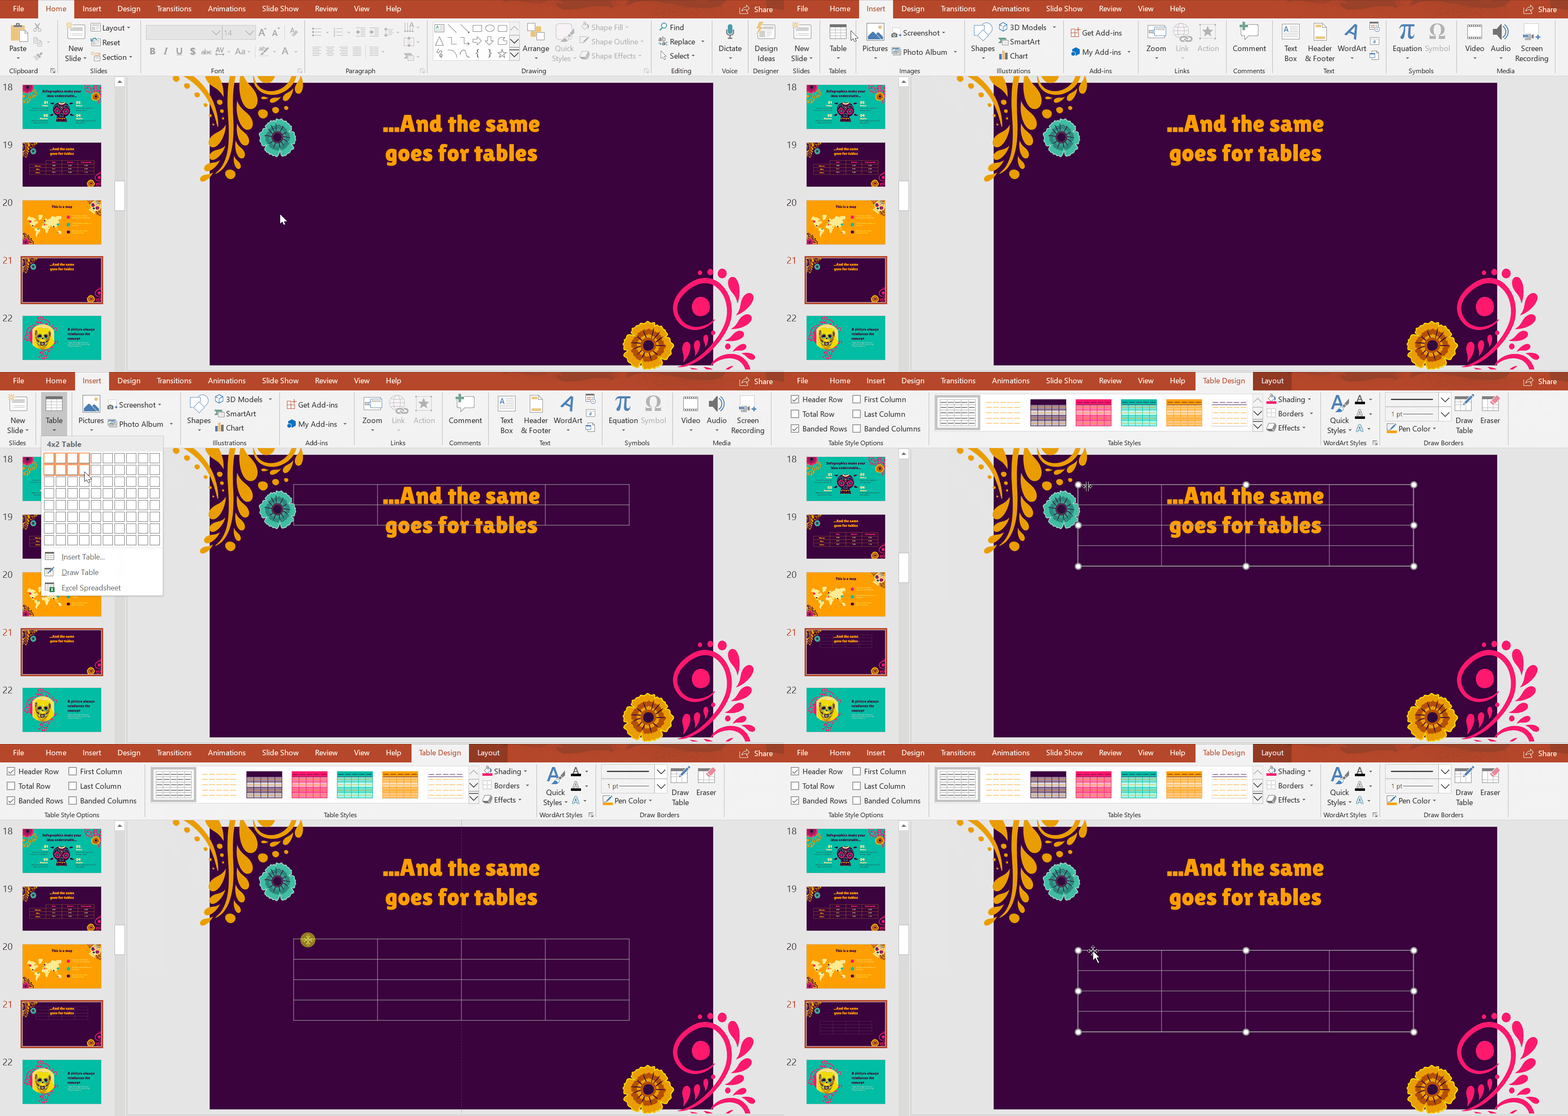
- Open your PowerPoint presentation and select the slide you want the table to be on.
- Click on Insert in the Table option. This will open a submenu, allowing you to configure it. In this tutorial, we are choosing one with four columns and four rows. When you create your table, you can build as many columns and rows as you wish.
- After it’s created, move it by first hovering your cursor over it until it becomes a cross. Then click and drag it to where you want it to be.
Pro tip: Keep an eye on the red visual guidelines that appear as you move elements around. This will help you to align your elements (in this case, the table).
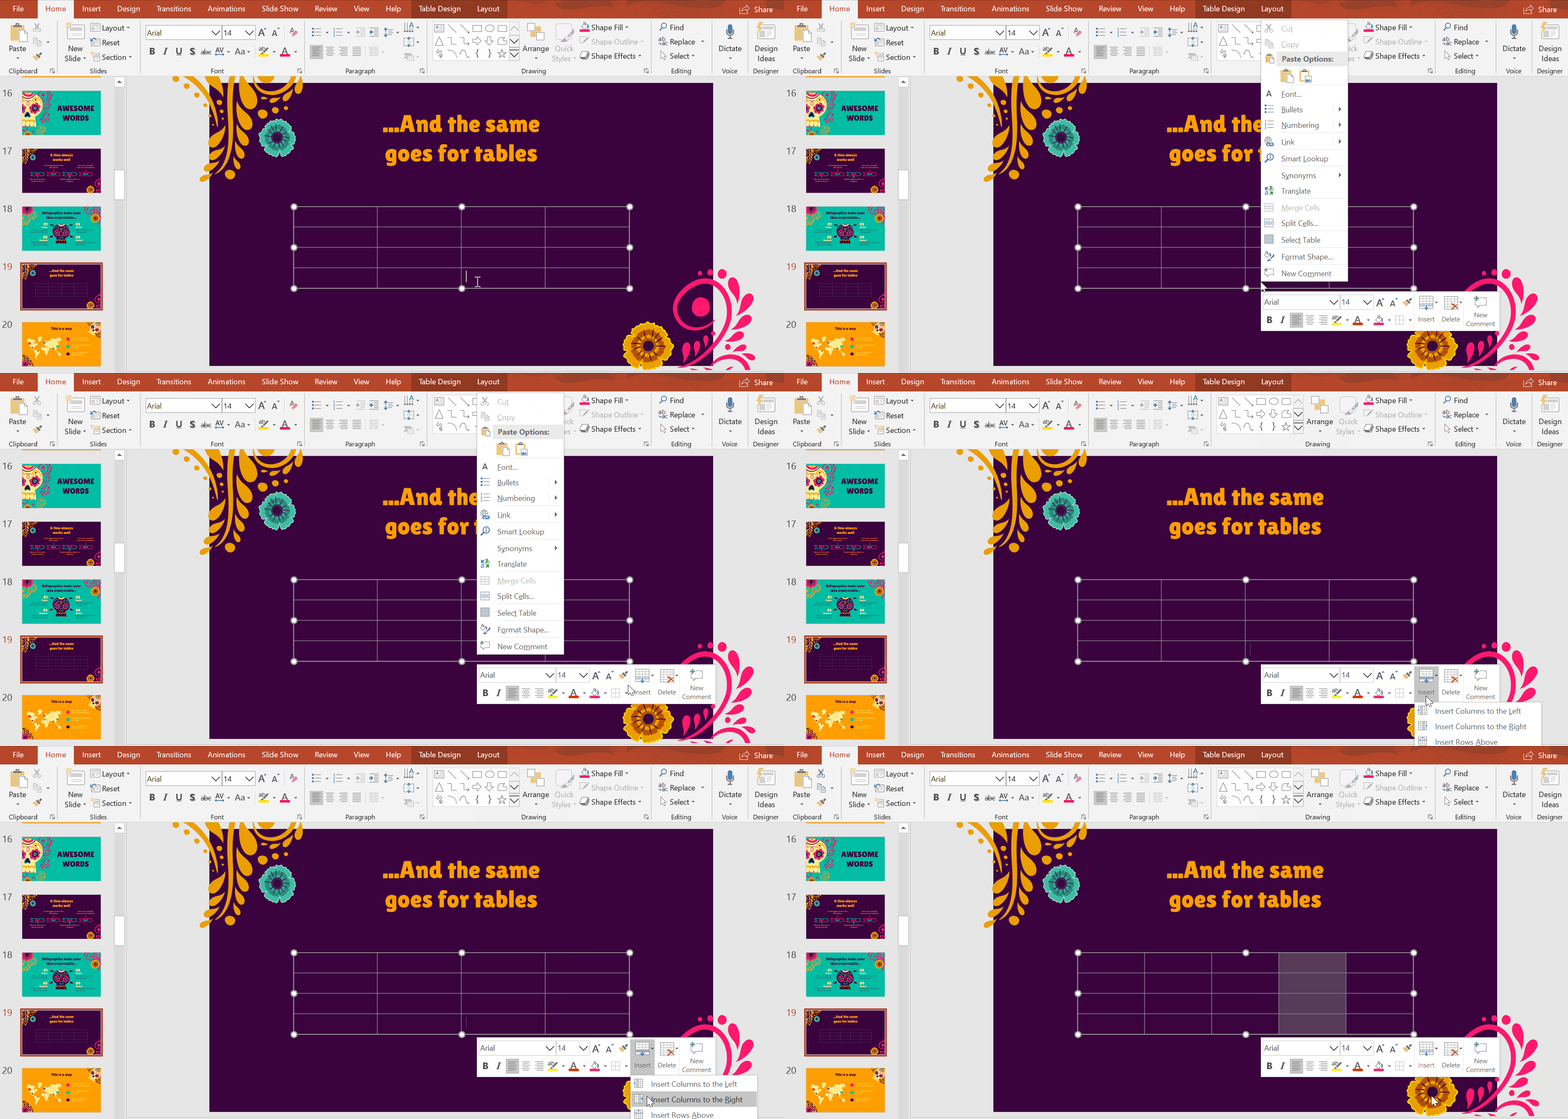
- If you need more rows or columns, you can add more by right-clicking on a cell, selecting Insert, and choosing the desired option.
- You could also delete some by with the option Delete.
Formatting the style of a table
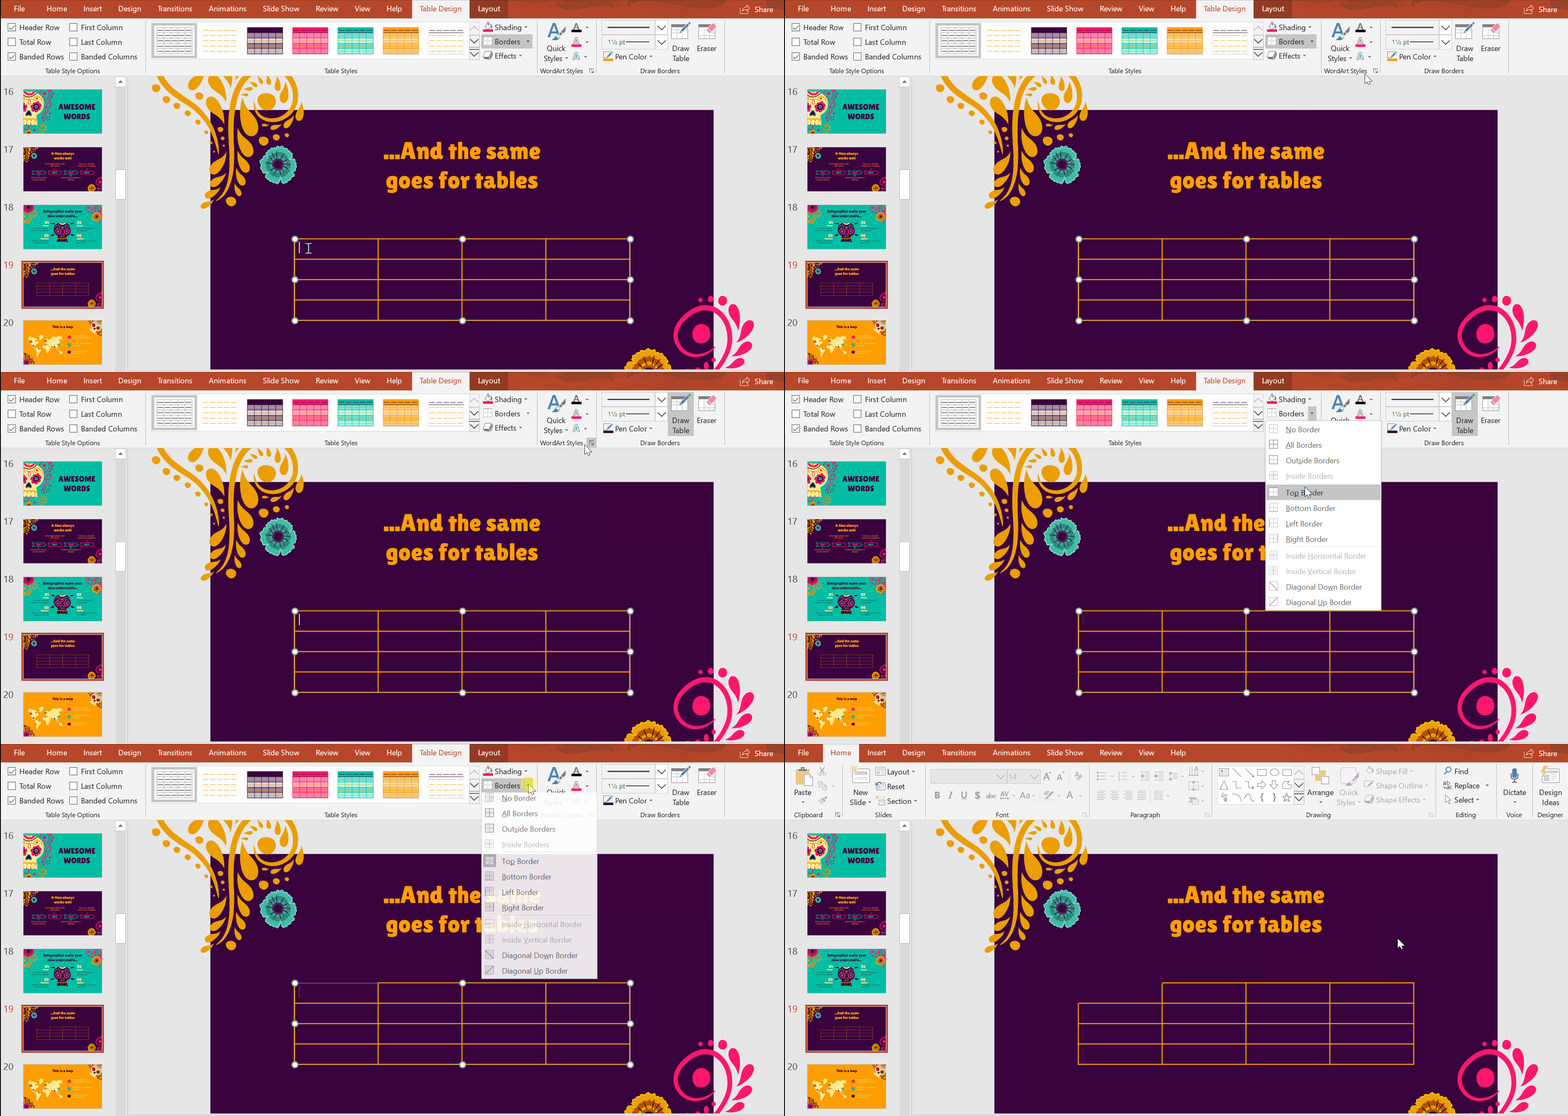
- You can change its color with the option Table Design. Click on one cell and drag your cursor over the cells you want to style.
- Select its color and line style. Options to do so include Pen Style, Pen Weight, and Pen Color.
- Then, go to Borders → All Borders. This will apply the style to all the cells.
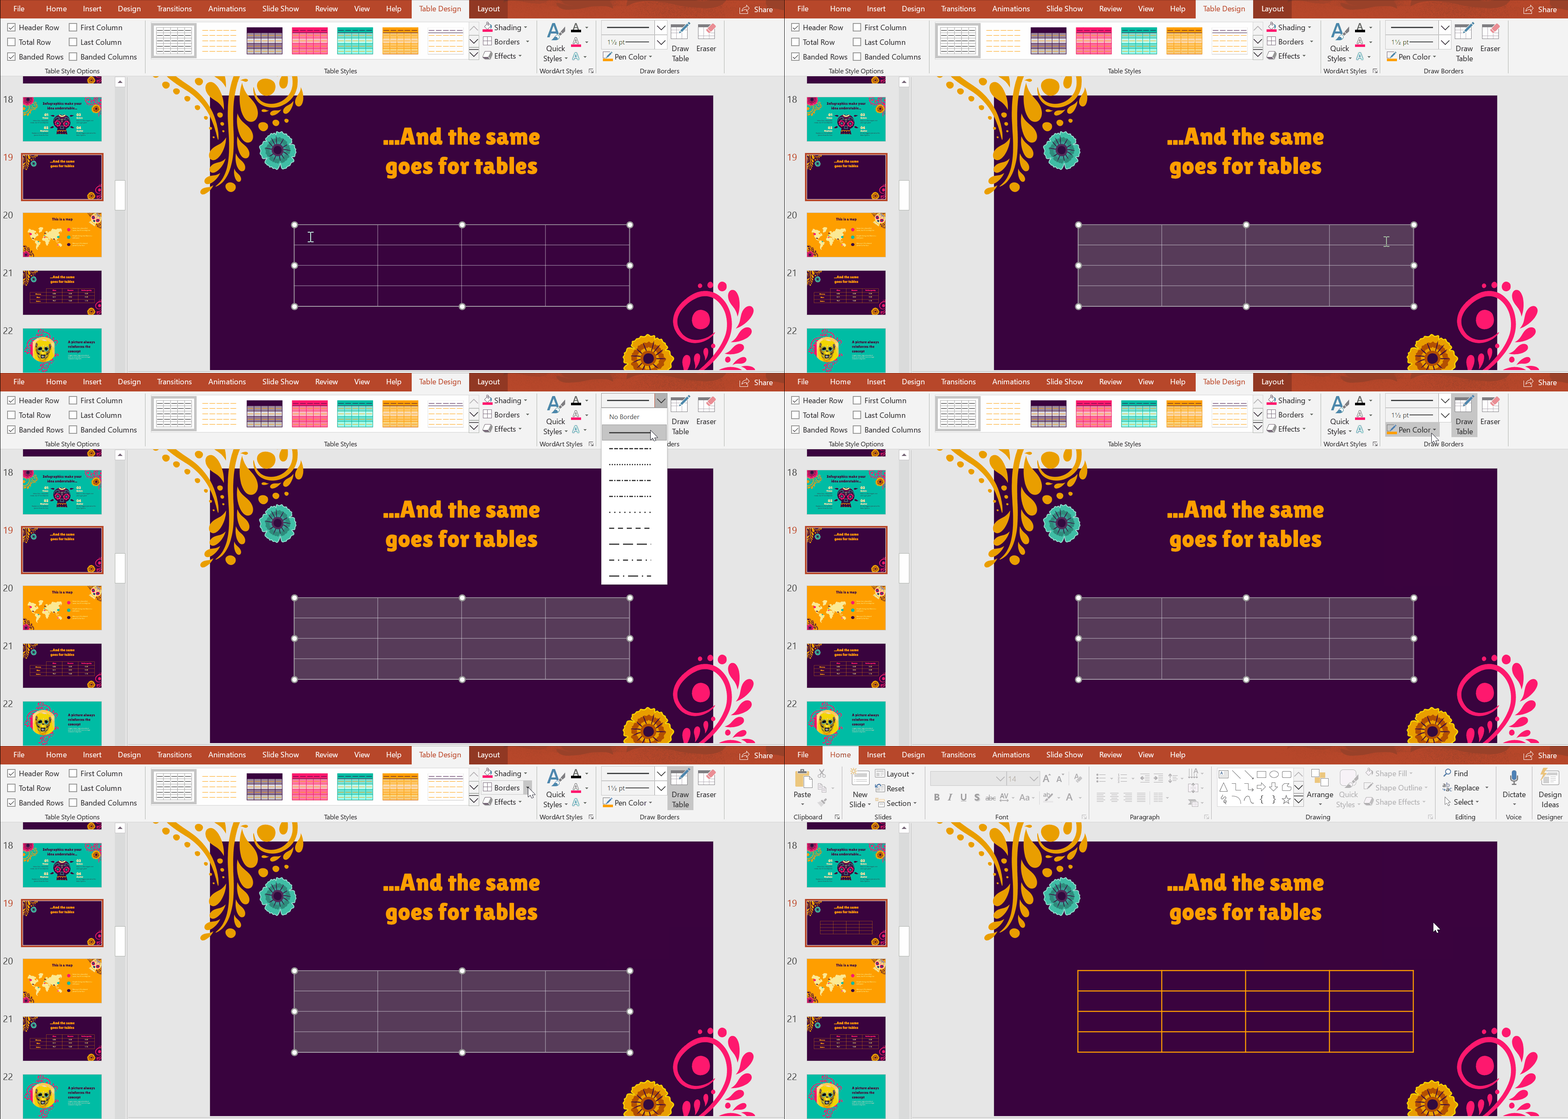
- You can make a cell’s border transparent by applying the color used for the slide’s background to it. To do so to the top-left cell, click on it, choose the corresponding shade under Pen Color, and select Borders → Top Border → Left Border.
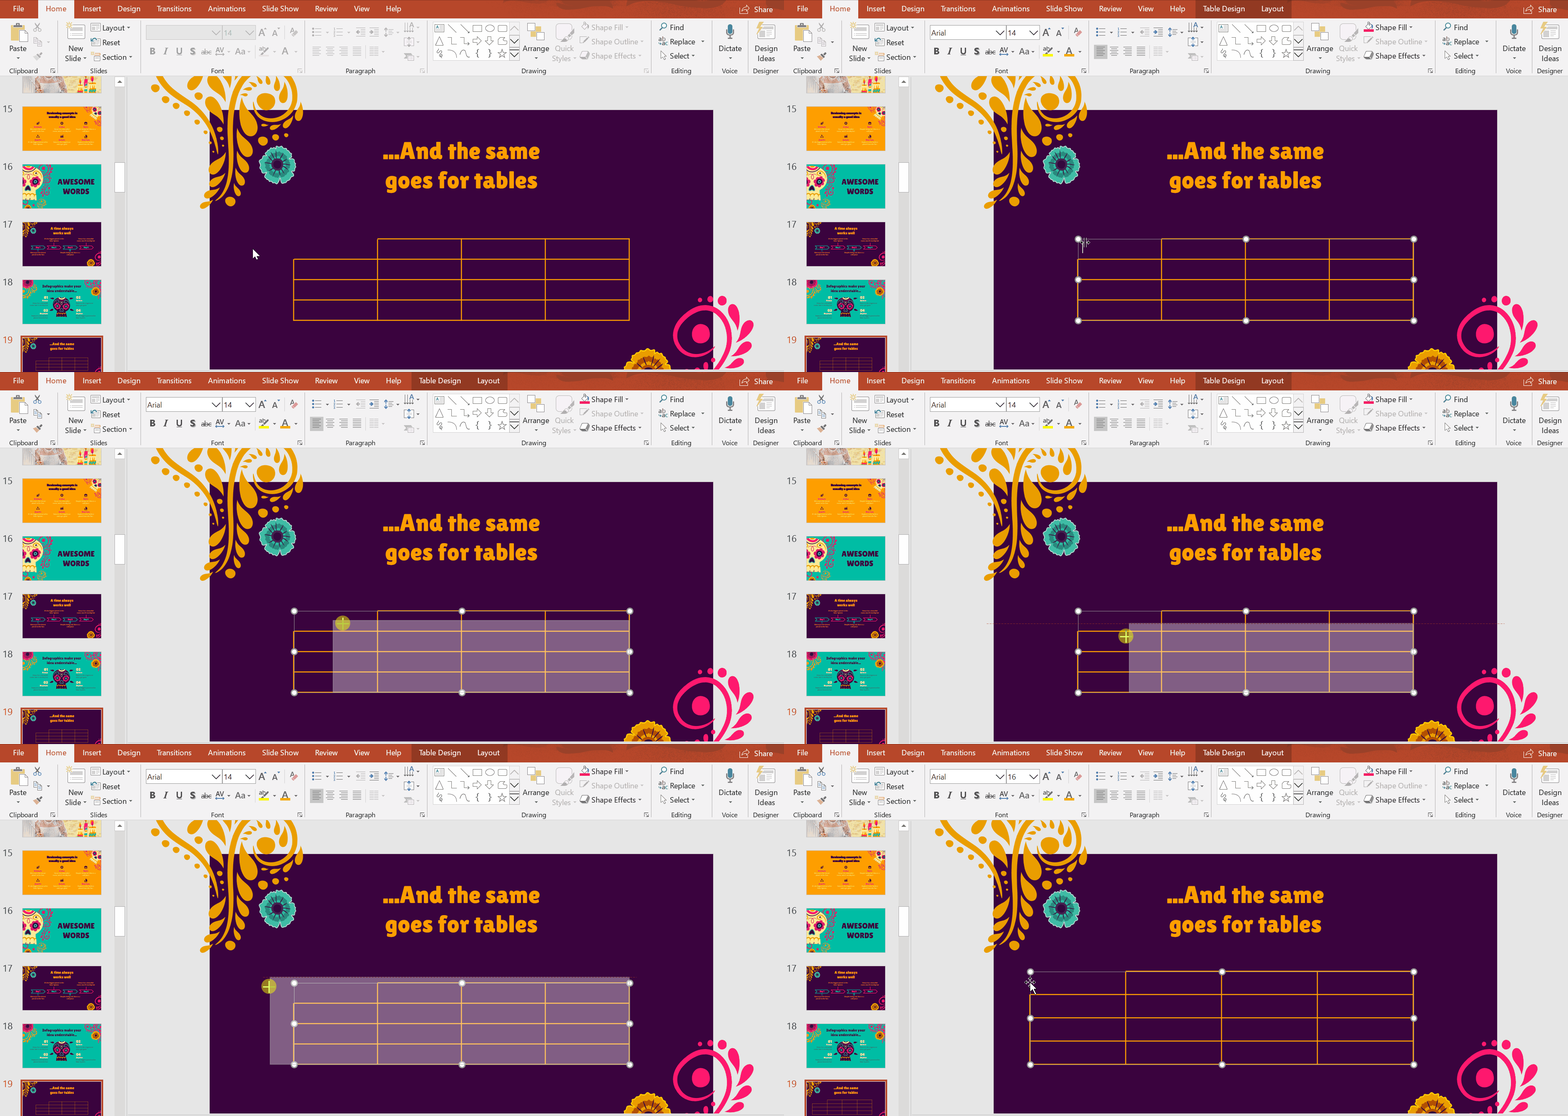
- Resize the table by clicking on it and dragging it inward or outward from any of its corners.
Pro tip: Hold Shift while doing this to ensure its dimensions are maintained.
Creating content in a table
- To start writing, double click on a cell and type.
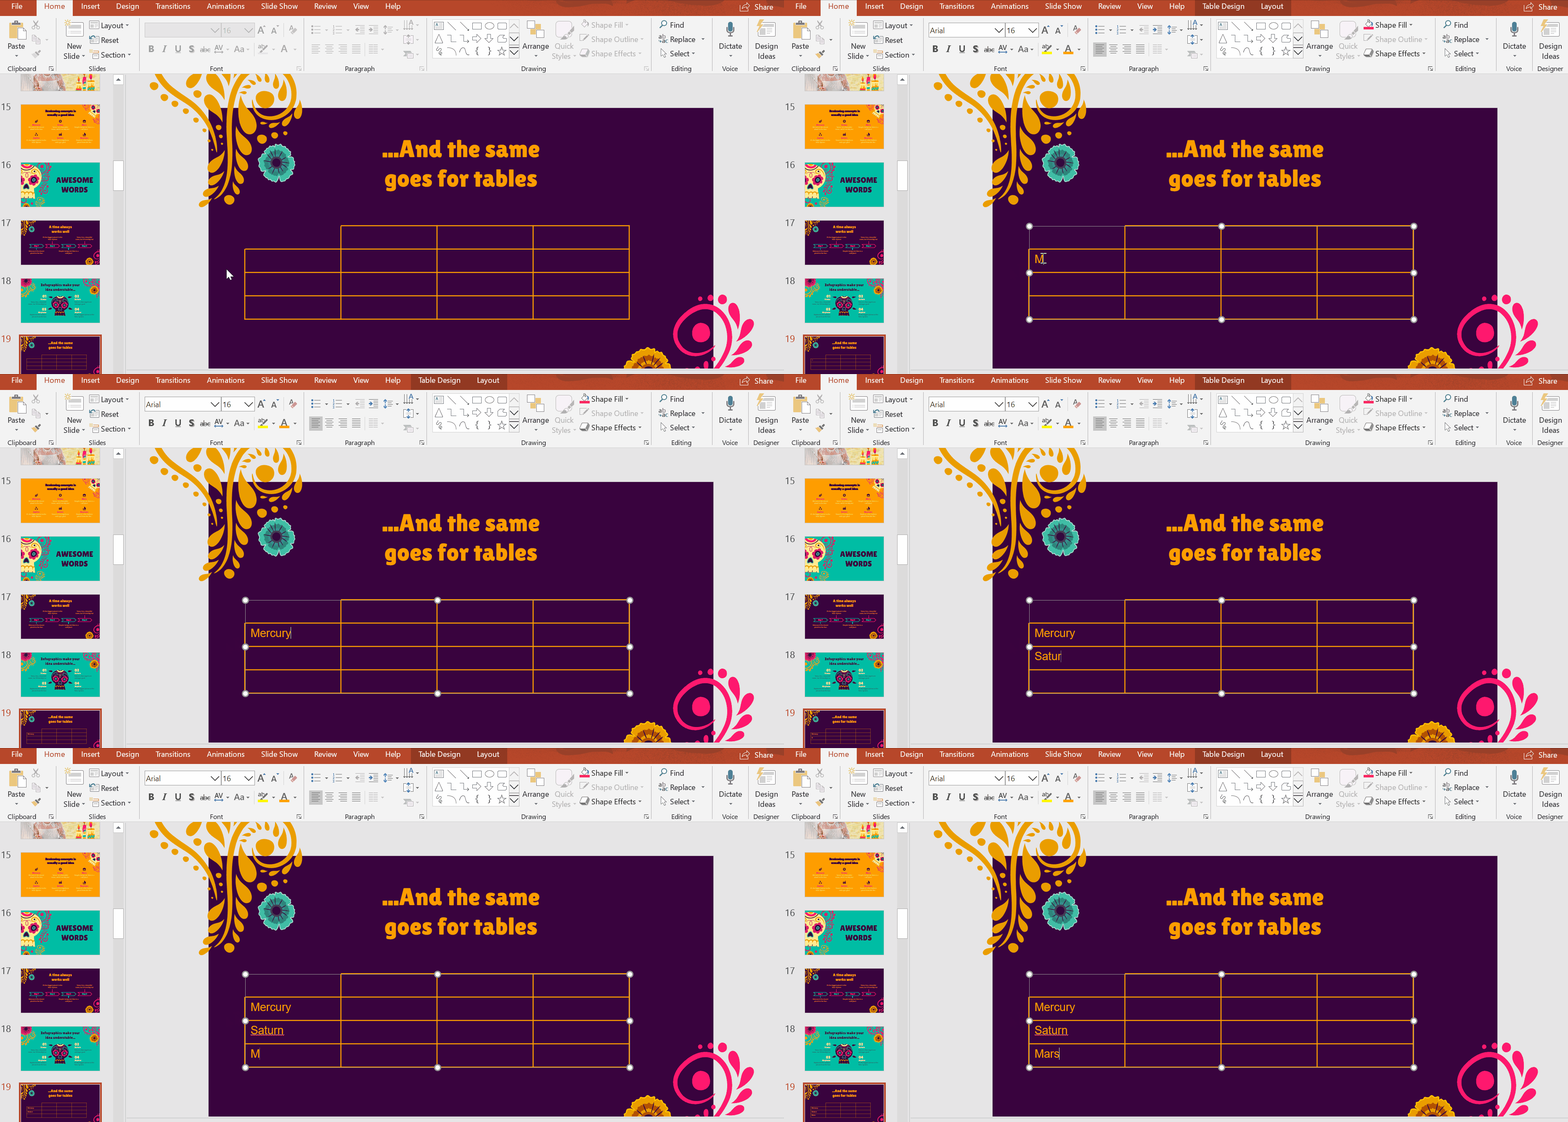
- Complete the cells with numbers and concise words. If you need to write sentences, keep them short and sweet.
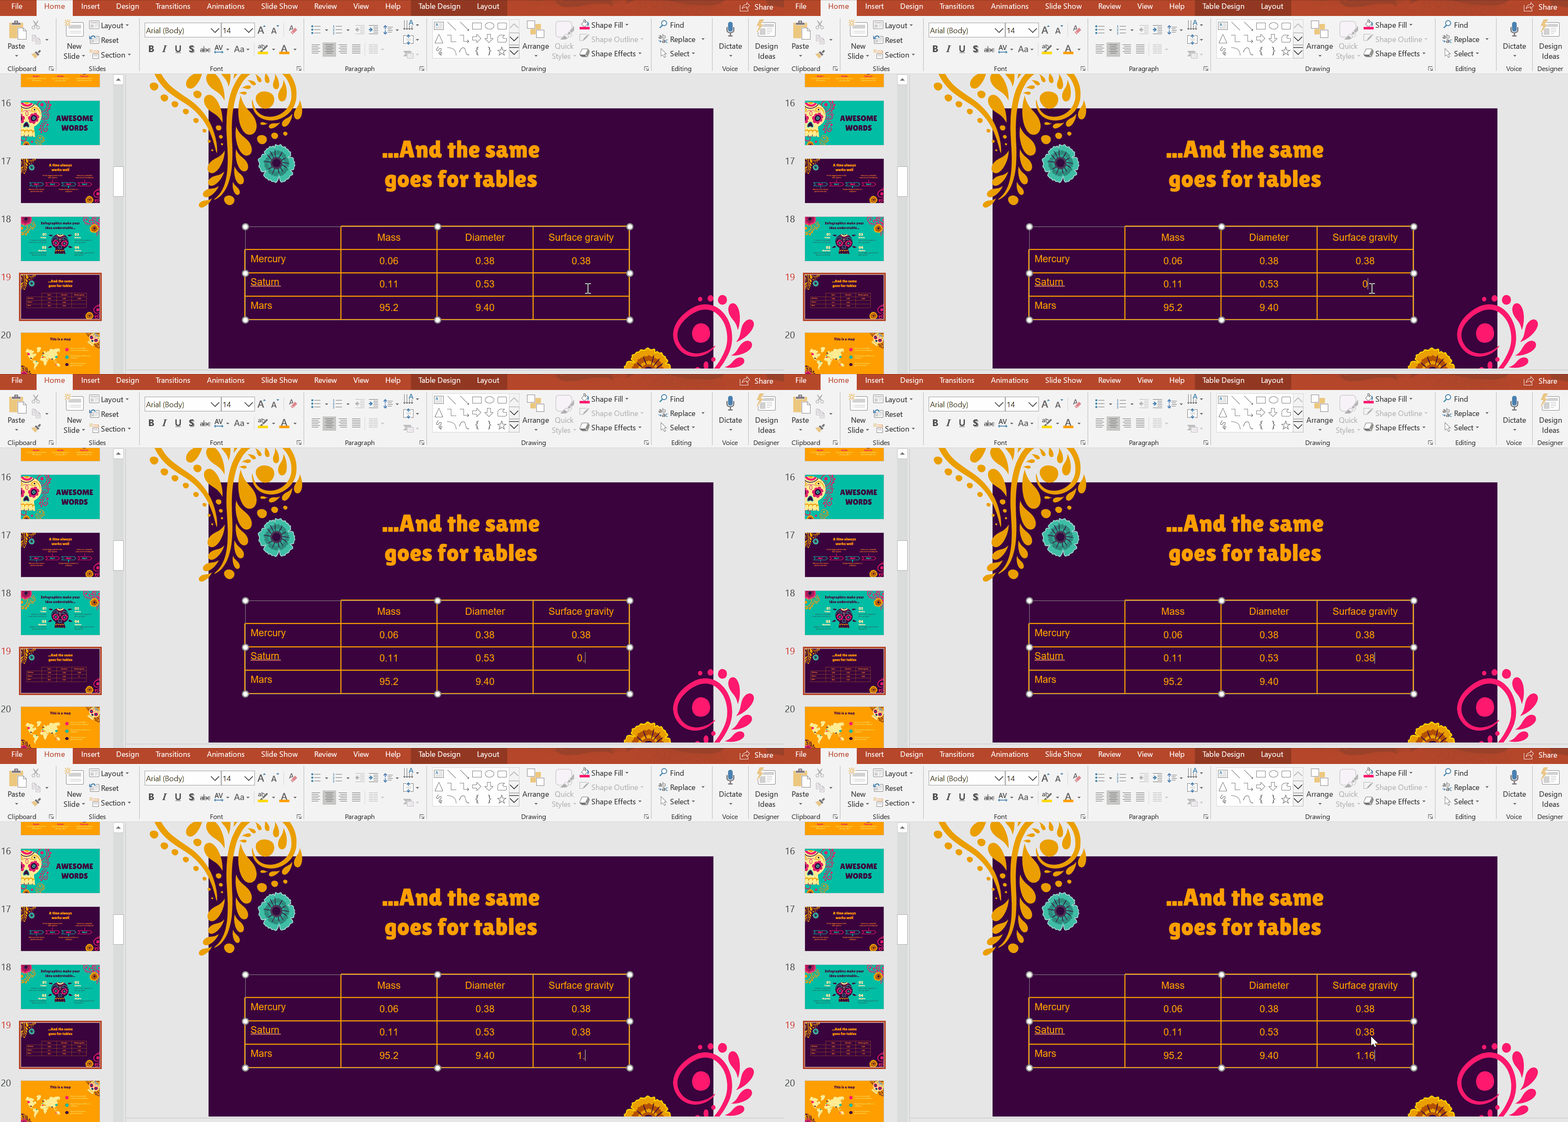
- To edit the typography, click and drag your cursor over the text you want to restyle. Select Font options: Font, Font Size, and Font Color. Use the theme’s typefaces and theme colors to maintain visual coherence.
- We recommend applying Bold to headings. It’s an easy way to highlight titles, establish hierarchy, and improve readability.
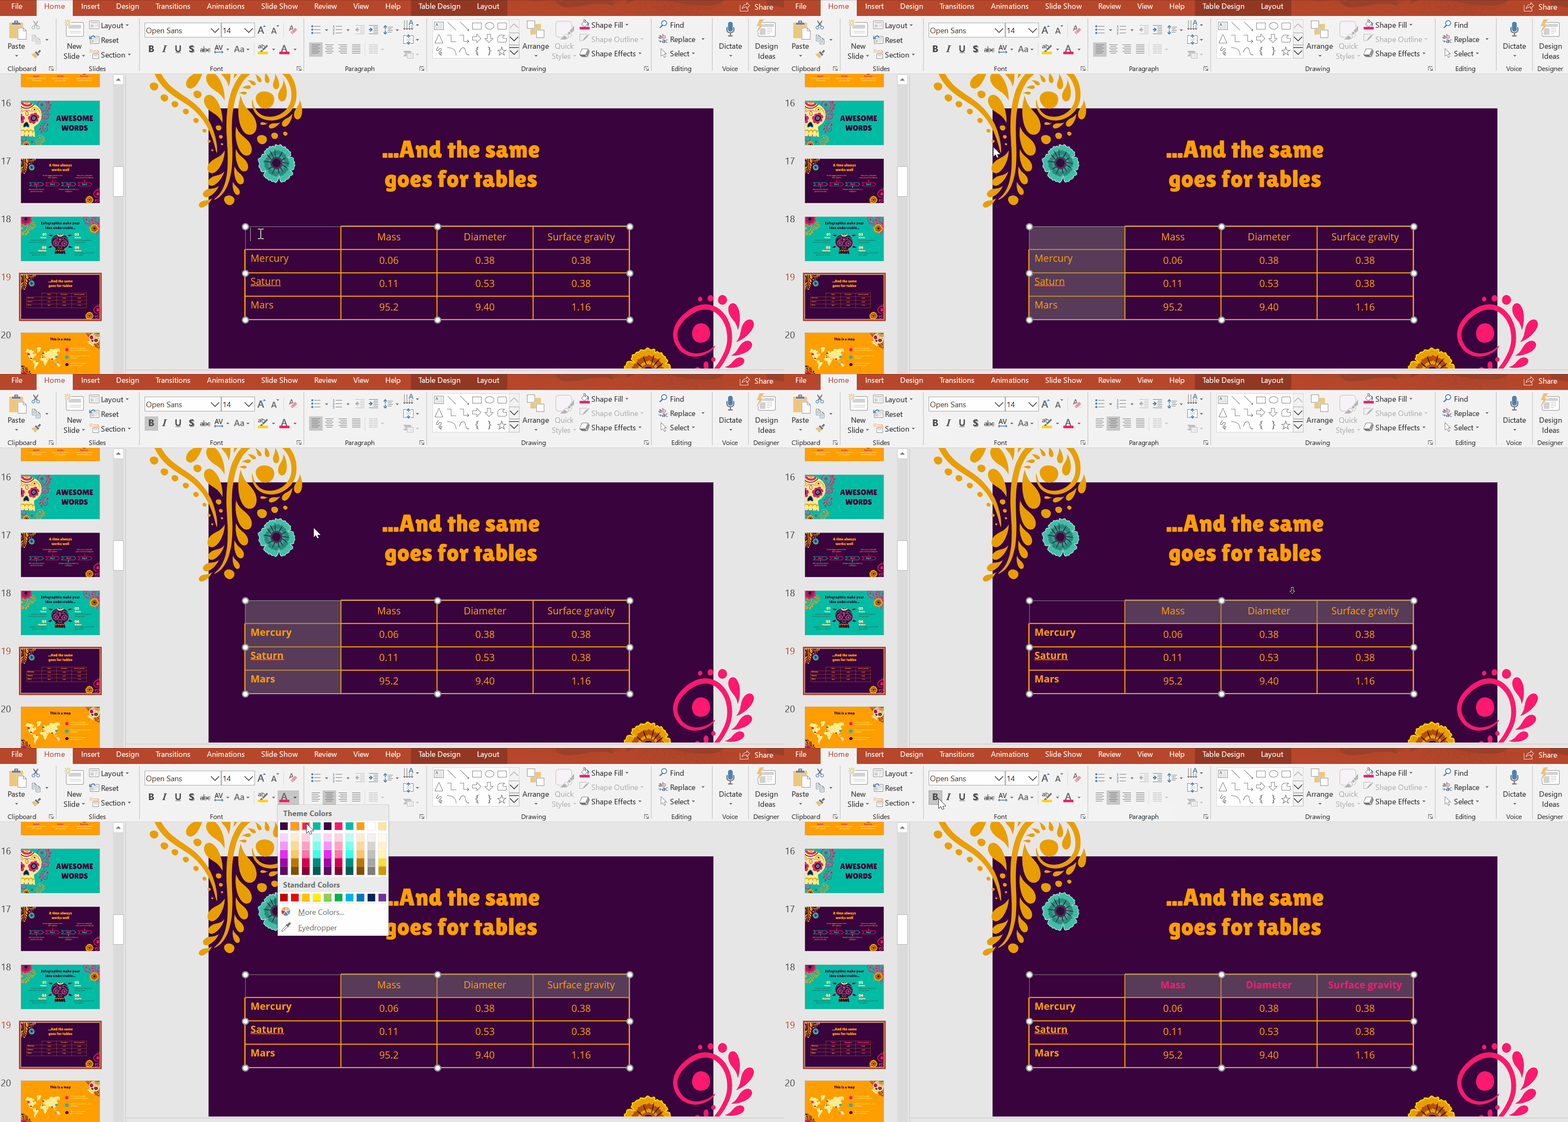
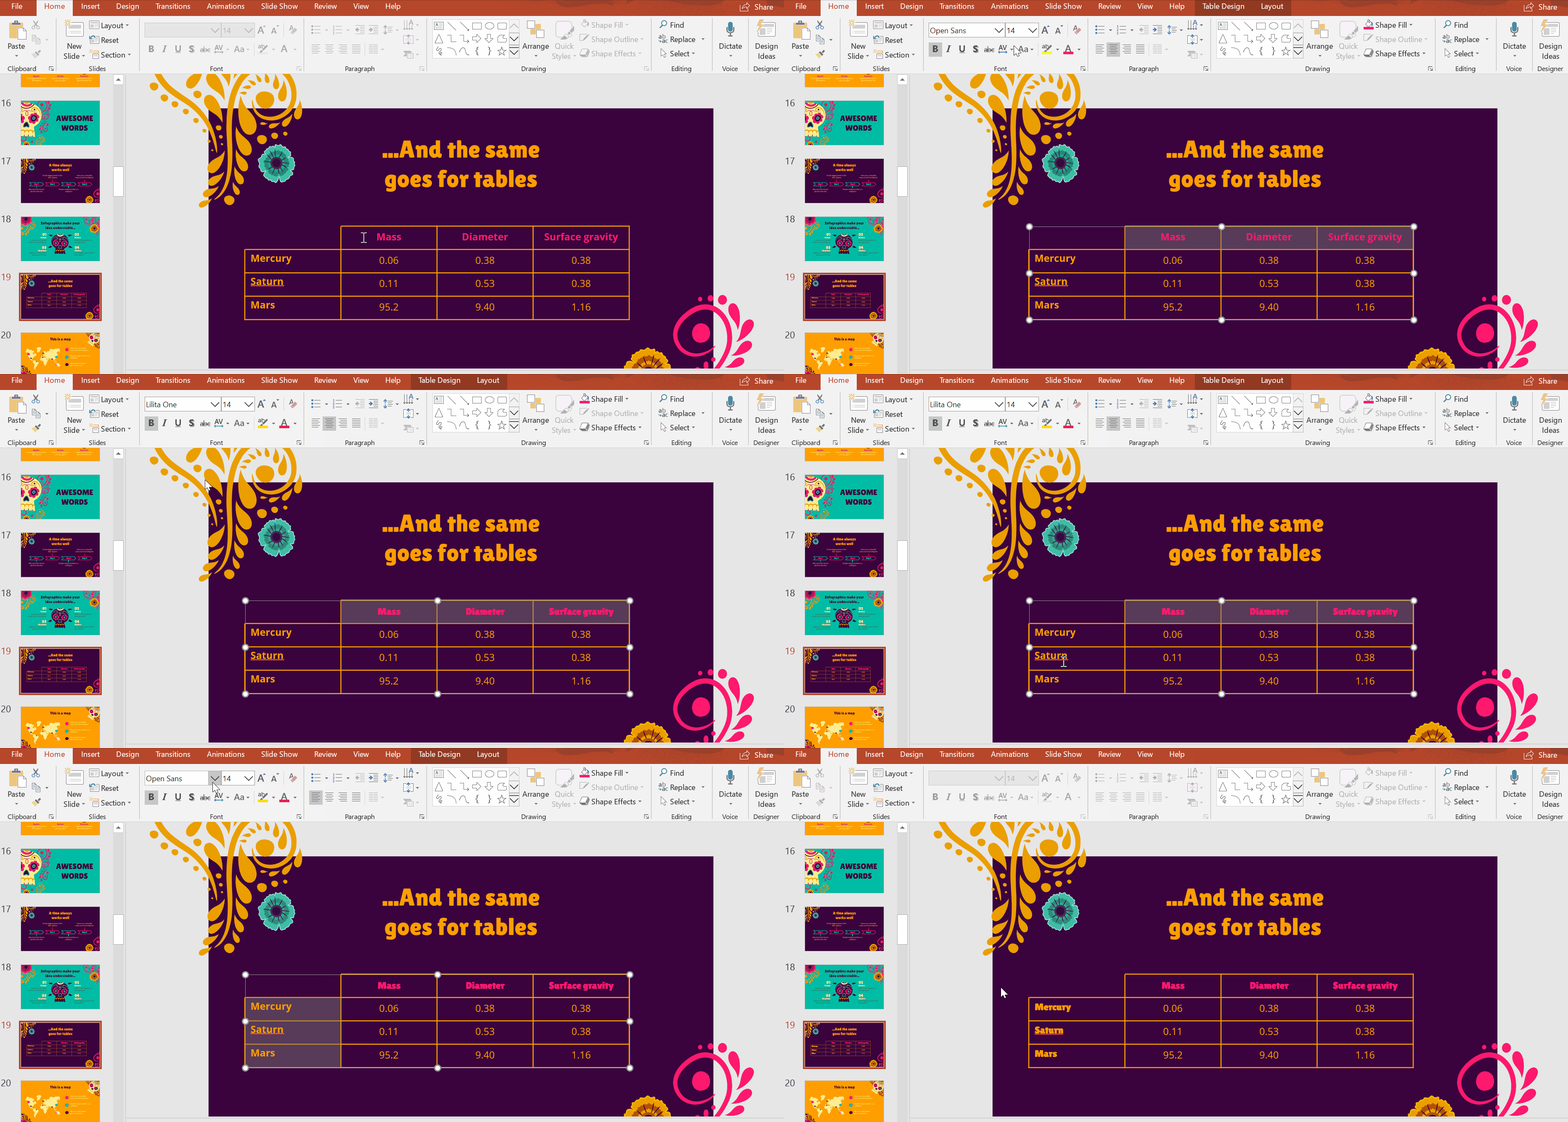
- For more impact, contrast two different typefaces—the more distinct they are from each other, the better. In this example, we’ve combined Open Sans with Lilita One.
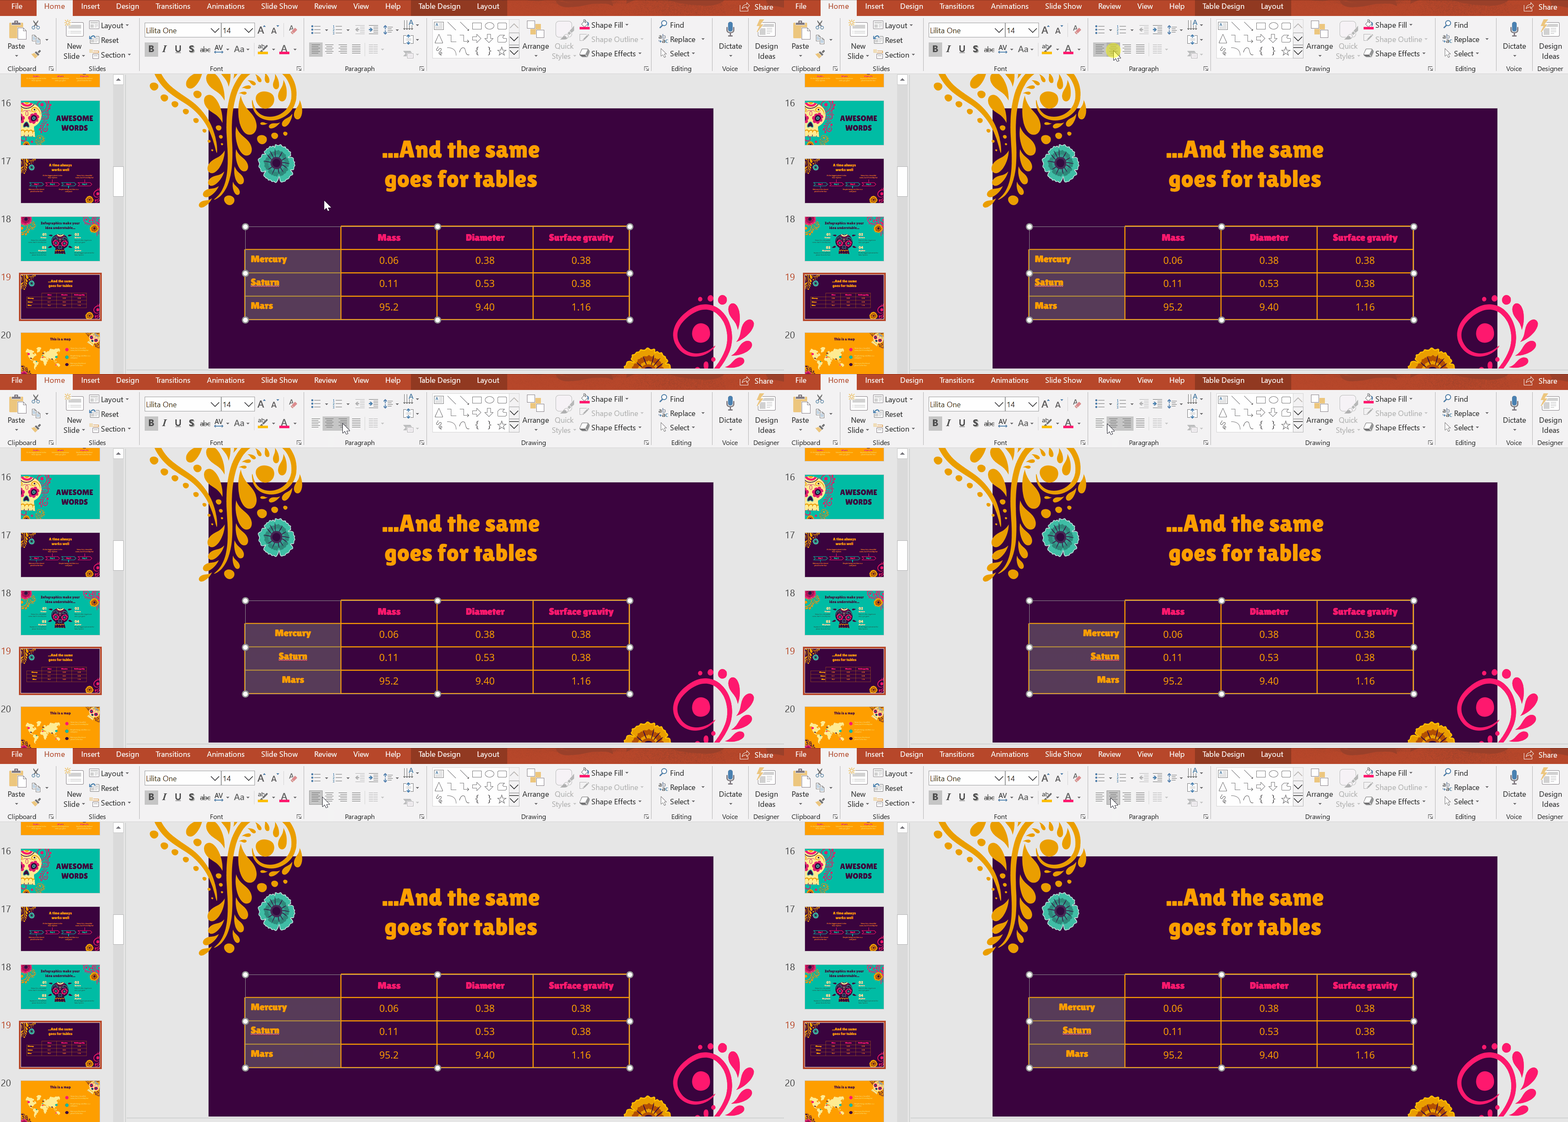
- Use Align to centralize your text. As a general rule of thumb, it looks better when aligned down the middle on tables.
Adding a table from a template
- As an alternative, you can also adapt any of our table infographic templates. Download the PowerPoint template and select from the many ready-to-use options.
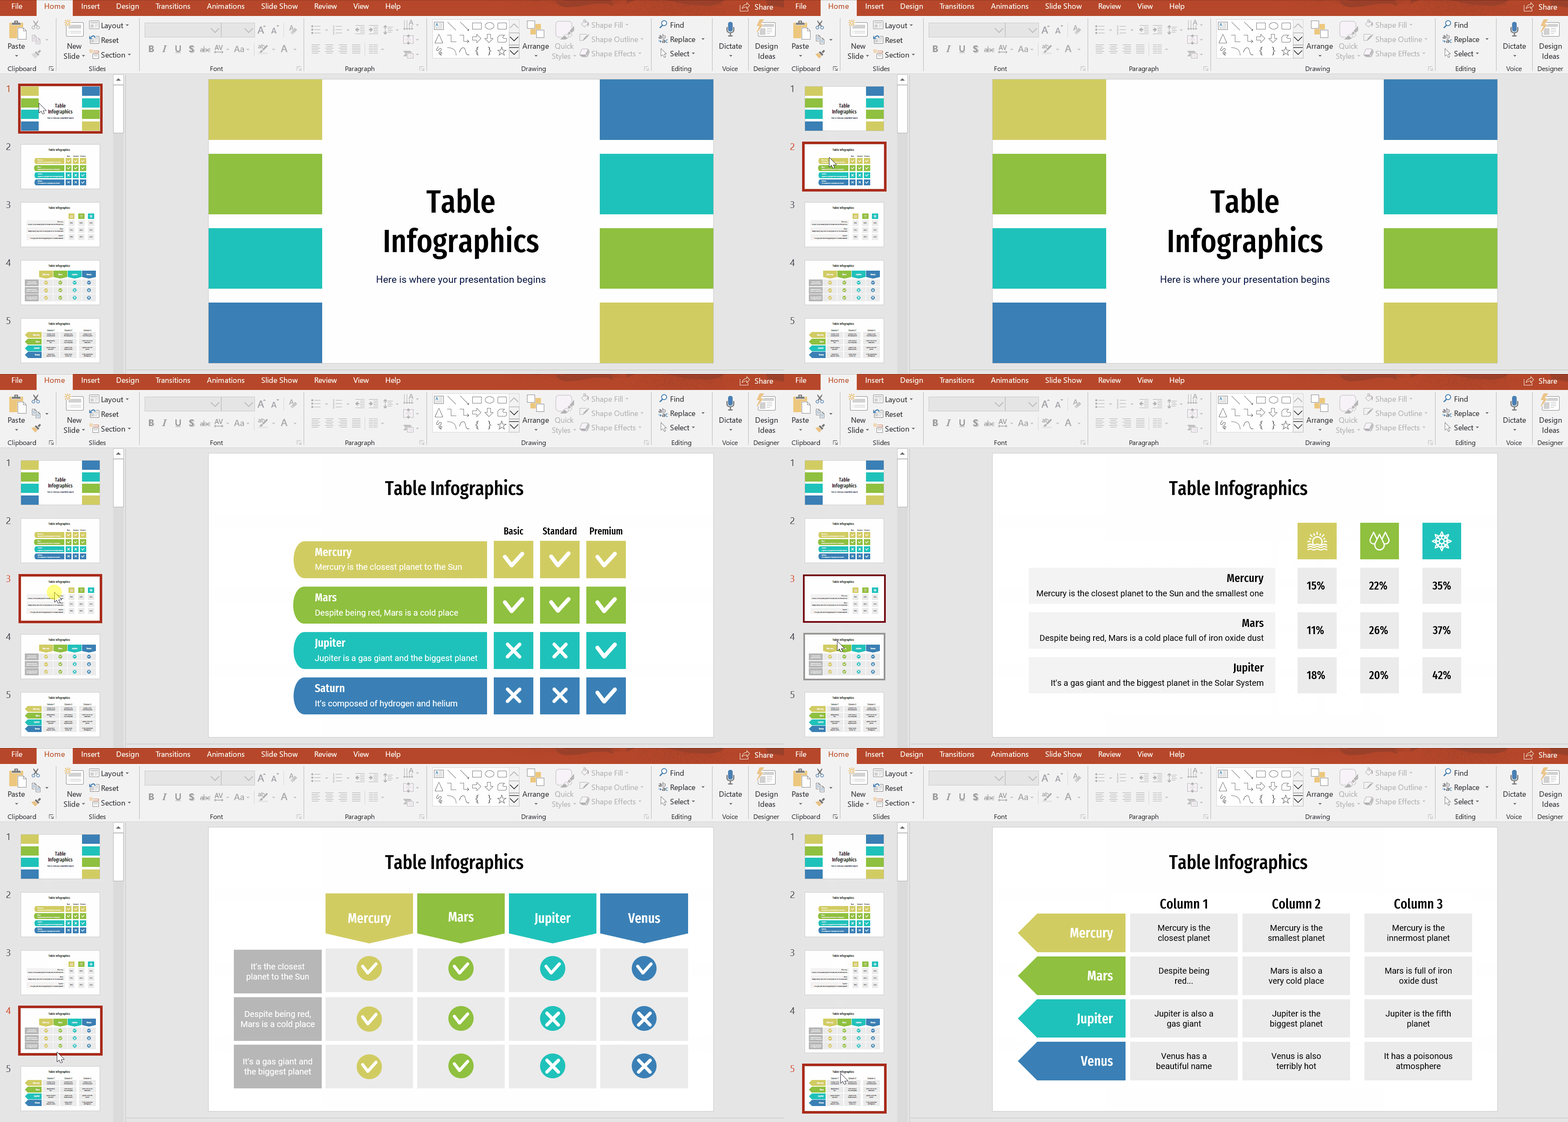
- To insert a design to your PowerPoint presentation, simply copy and paste (Ctrl C + Ctrl V).
Pro tip: While regular tables usually consist of a number of cells, its infographics version can take on different formats and styles like lists, element blocks, etc. If you want to use the whole infographic, click and drag over its entire area to select and copy it, and then paste it.
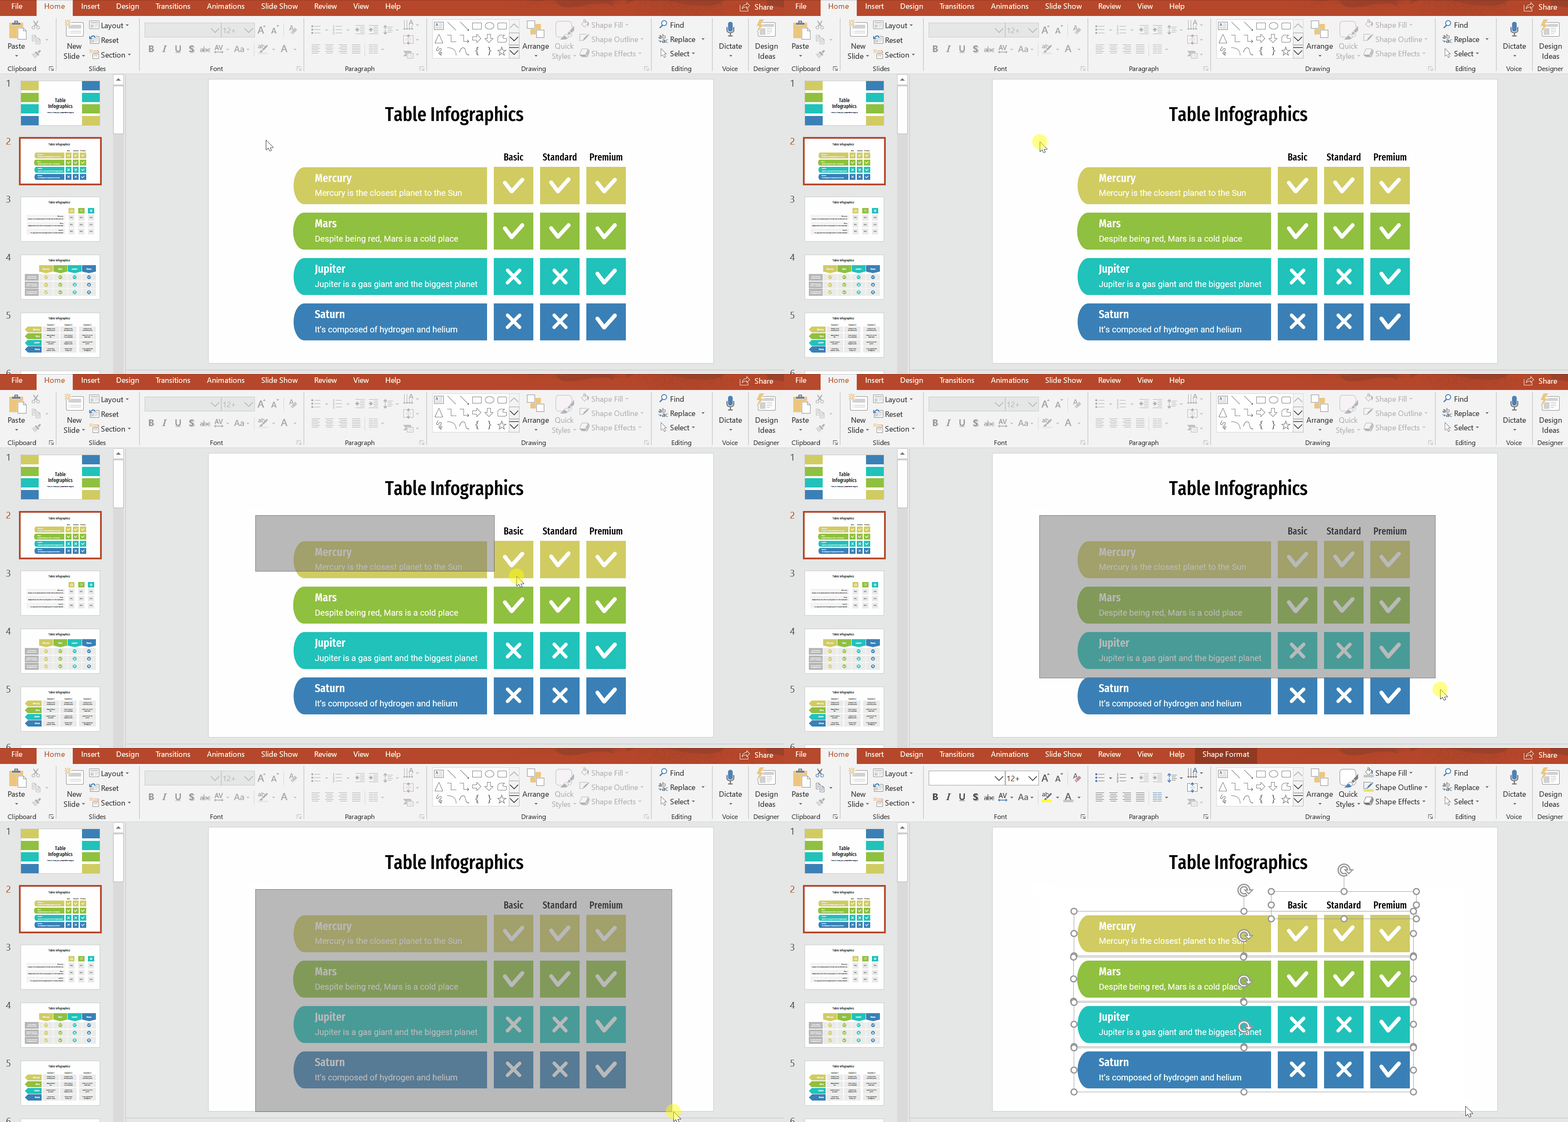
- Once that’s done, you can edit how it looks. Resize it as needed. Just as you’ve done before, select the area of the infographic and drag it inward or outward.
- Style it according to the presentation’s overall theme. To do so, use the options Shape Fill, Shape Outline, as well as with the previously mentioned options for text (Font, Font Color, and more).
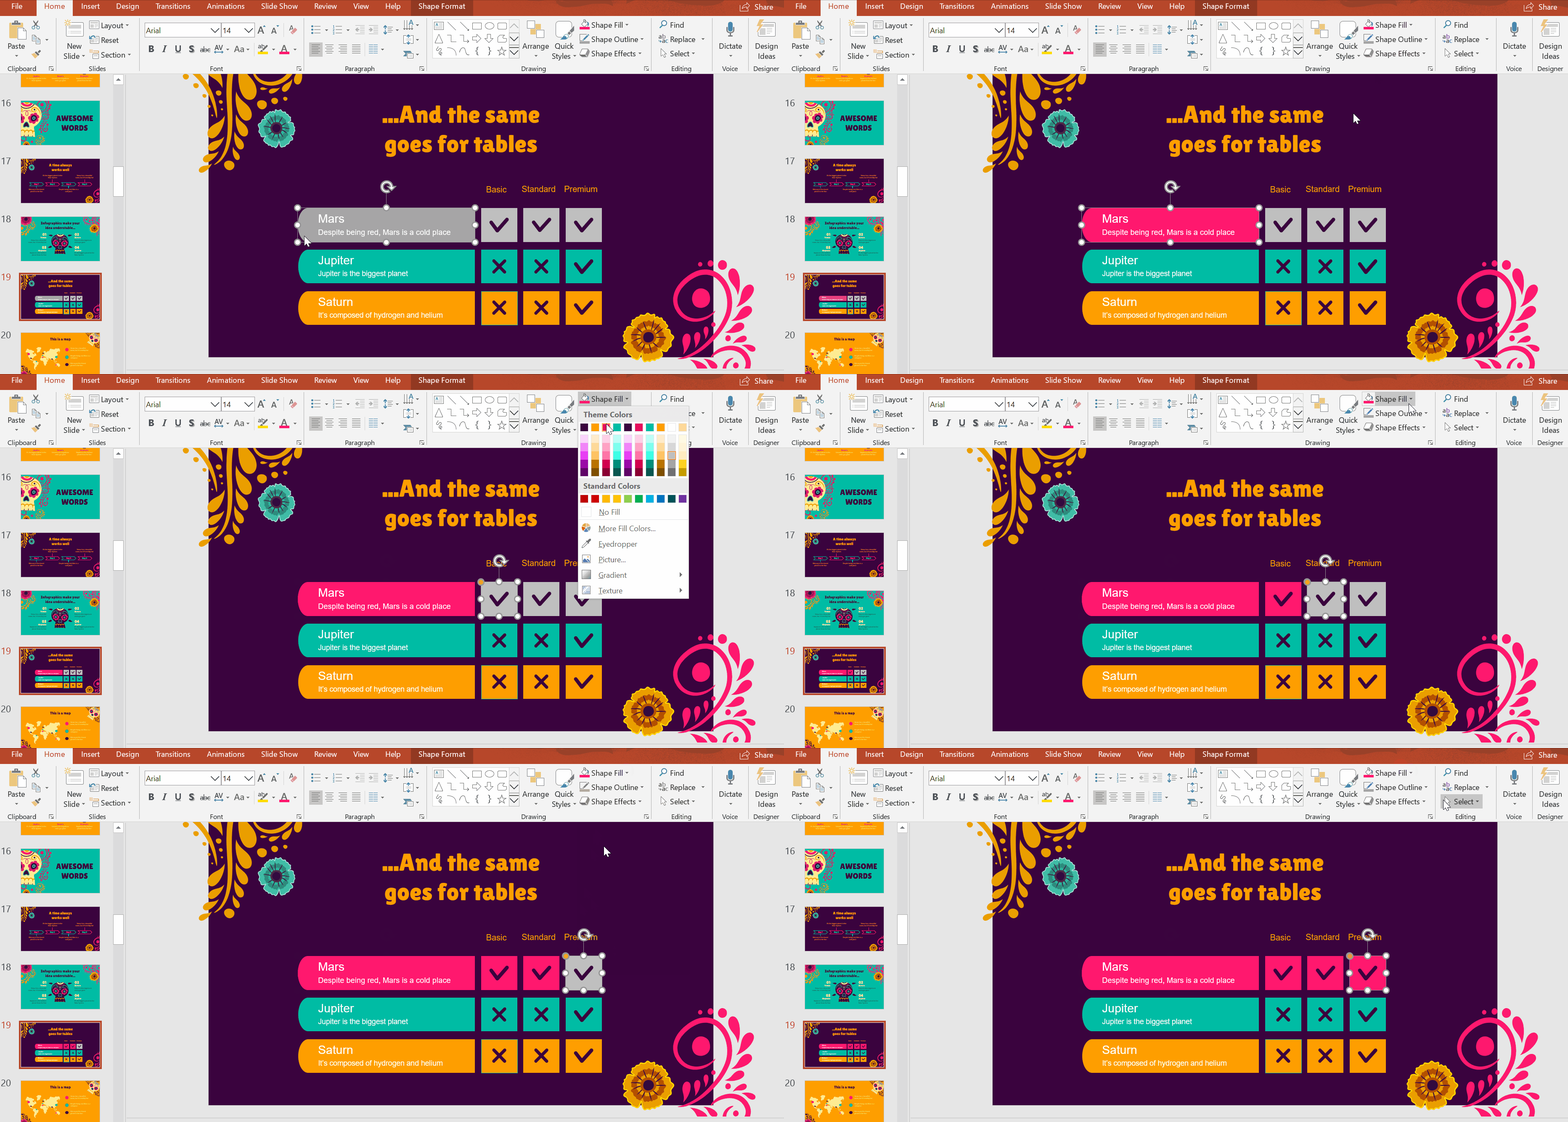
- Nice work! You’ve learned how to create and format tables in PowerPoint!
At GreatPPT, we have a plethora of gorgeous templates that are completely free for you to customize according to your needs. Hop on over to our selection of free PowerPoint themes and check it out!
